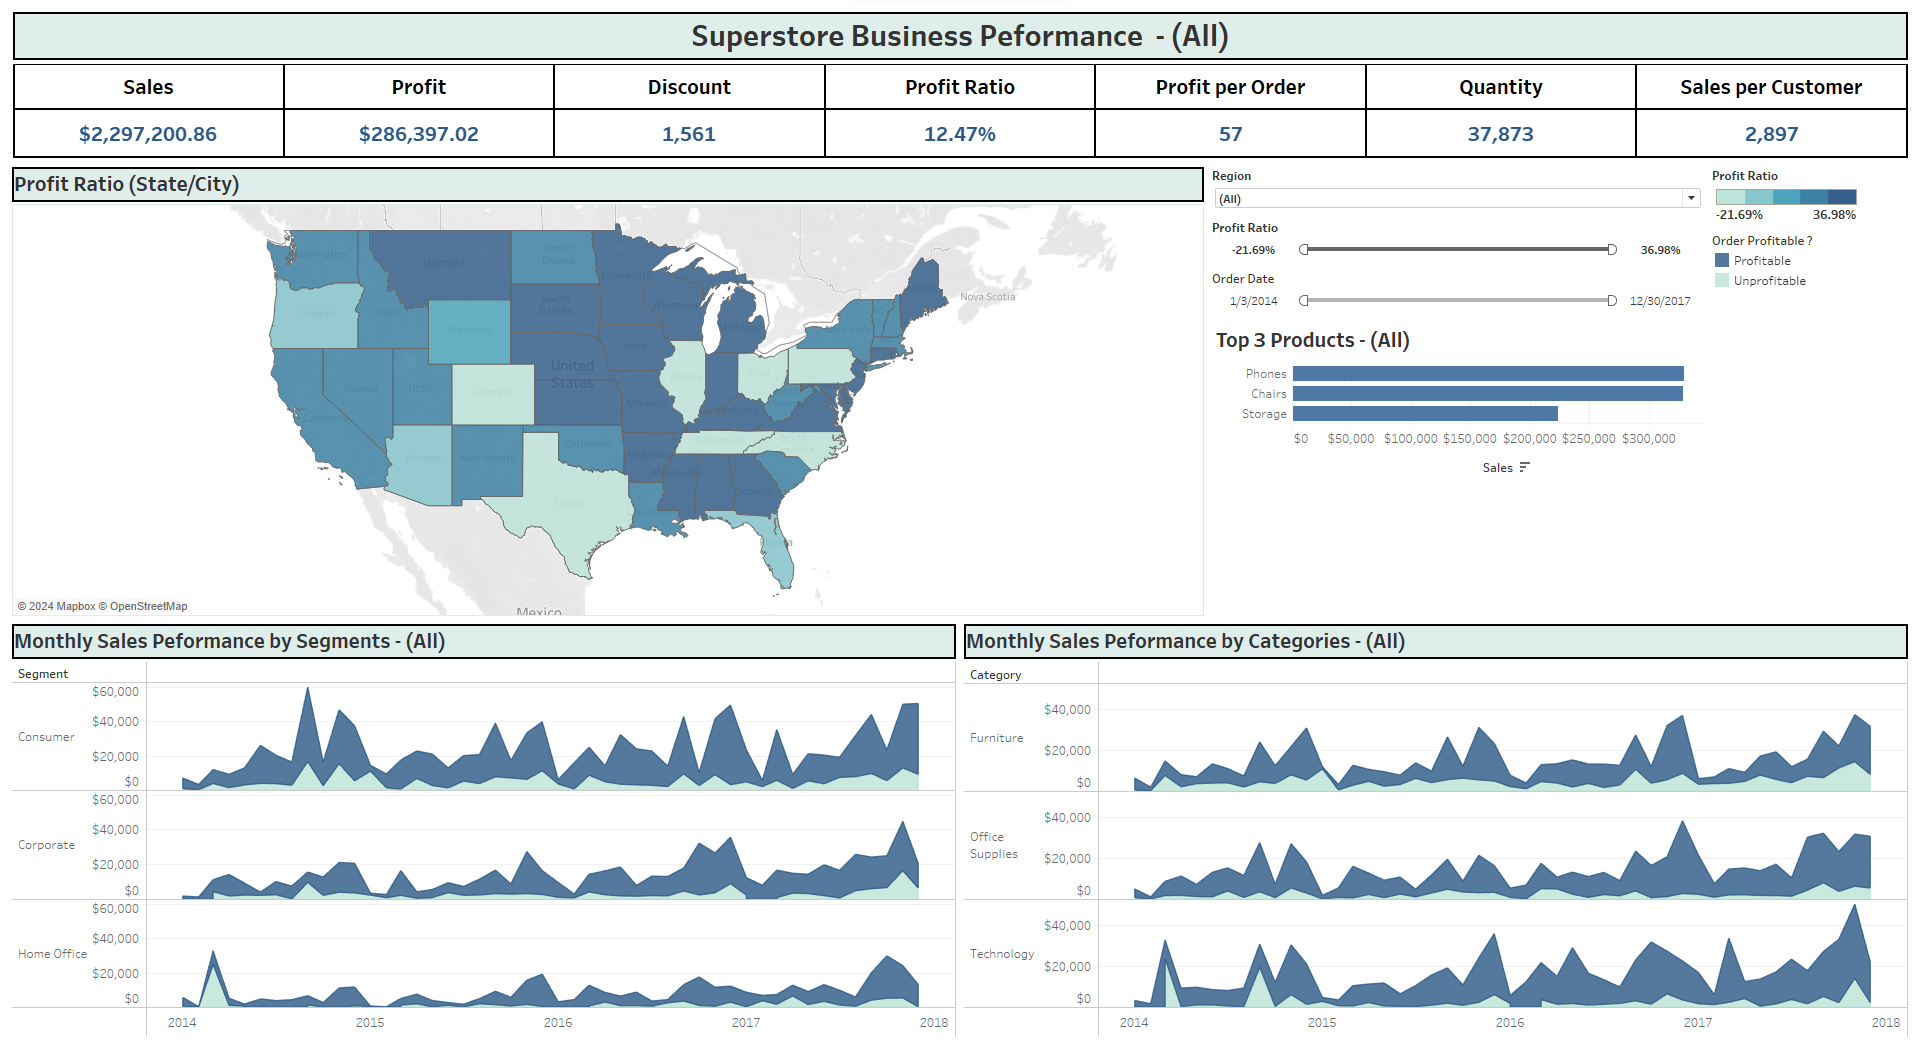
Superstore Tableau Dashboard
Developed an interactive dashboard utilizing sales data to provide actionable insights for a Superstore Giant to optimize sales.
Developed an interactive dashboard utilizing sales data to provide actionable insights for a Superstore Giant to optimize sales.
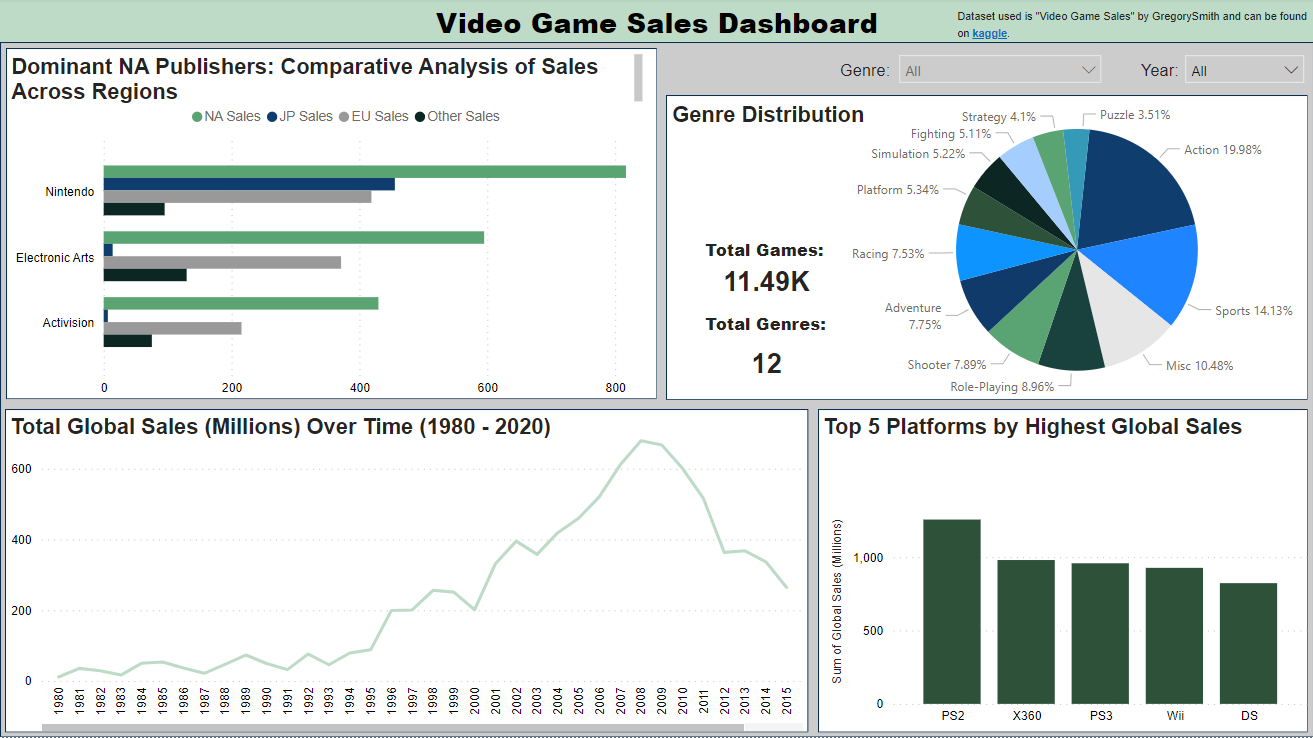
Developed a dynamic data visualization dashboard using a comprehensive video game sales dataset sourced from Kaggle.
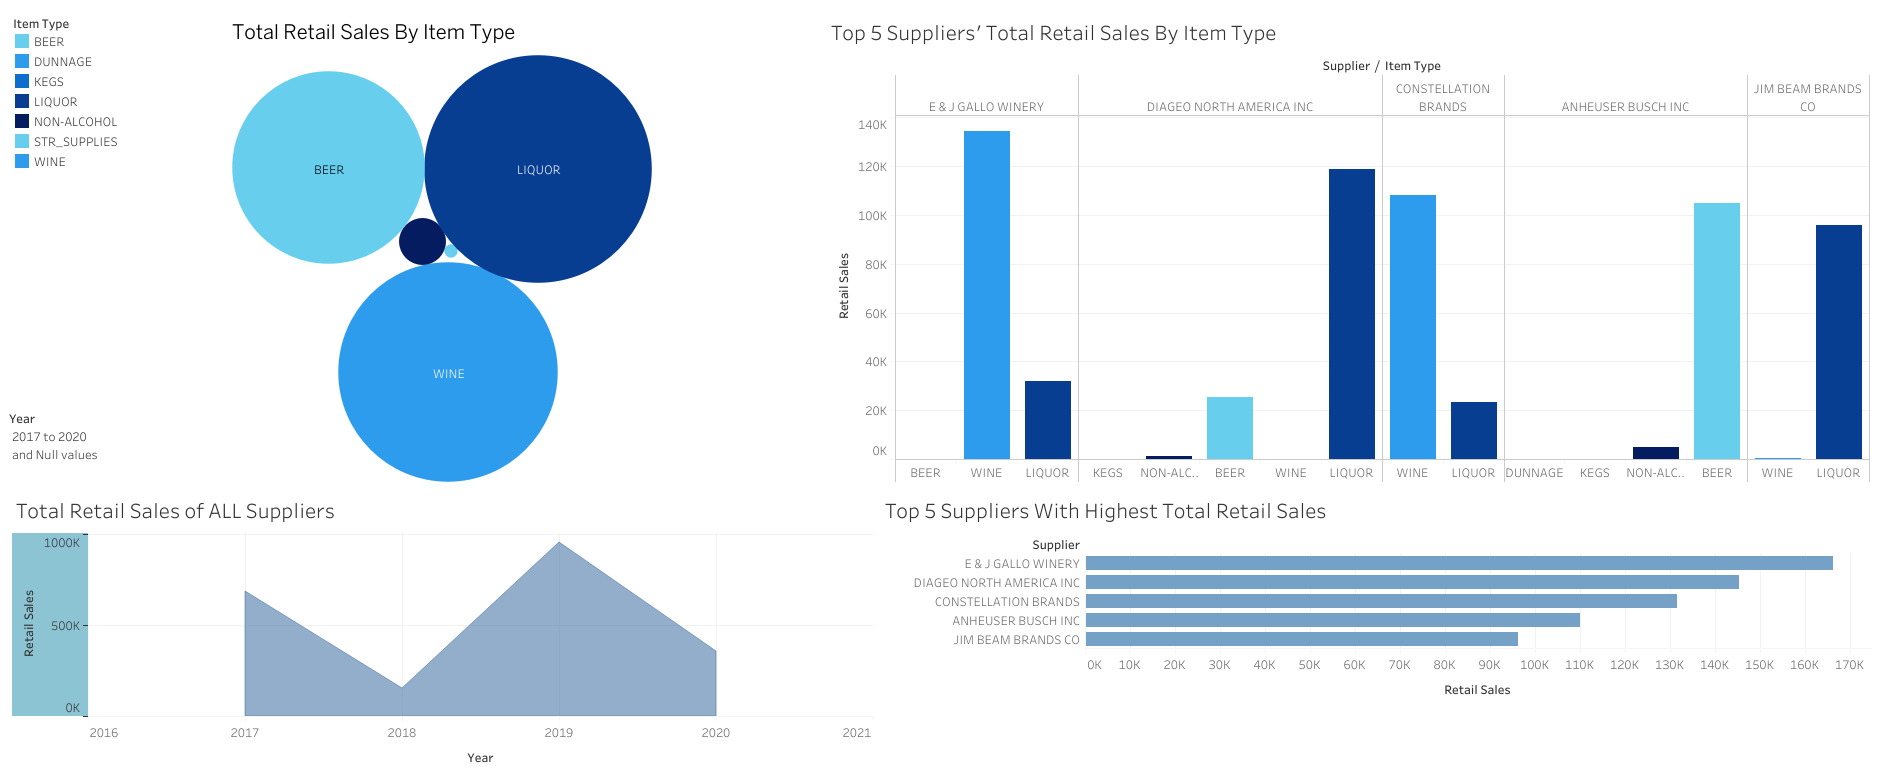
Utilized Microsoft SQL Server Management Studio to import and query on a dataset about liquor sales in Maryland. Documented my results through PowerPoint and created a Tableau dashboard.
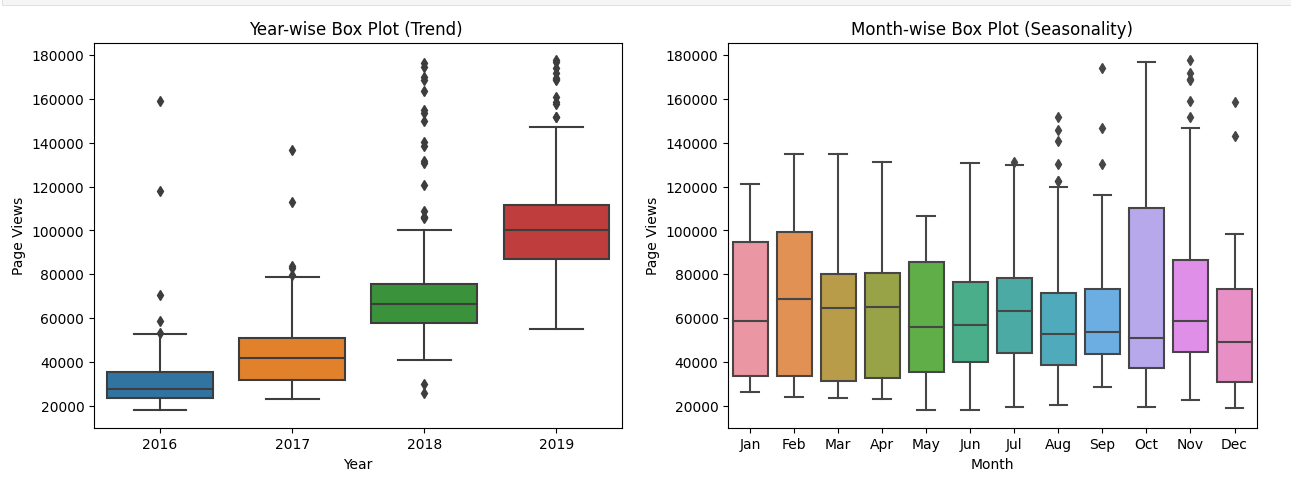
Visualized time series data using Python libraries Pandas, Matplotlib, and Seaborn
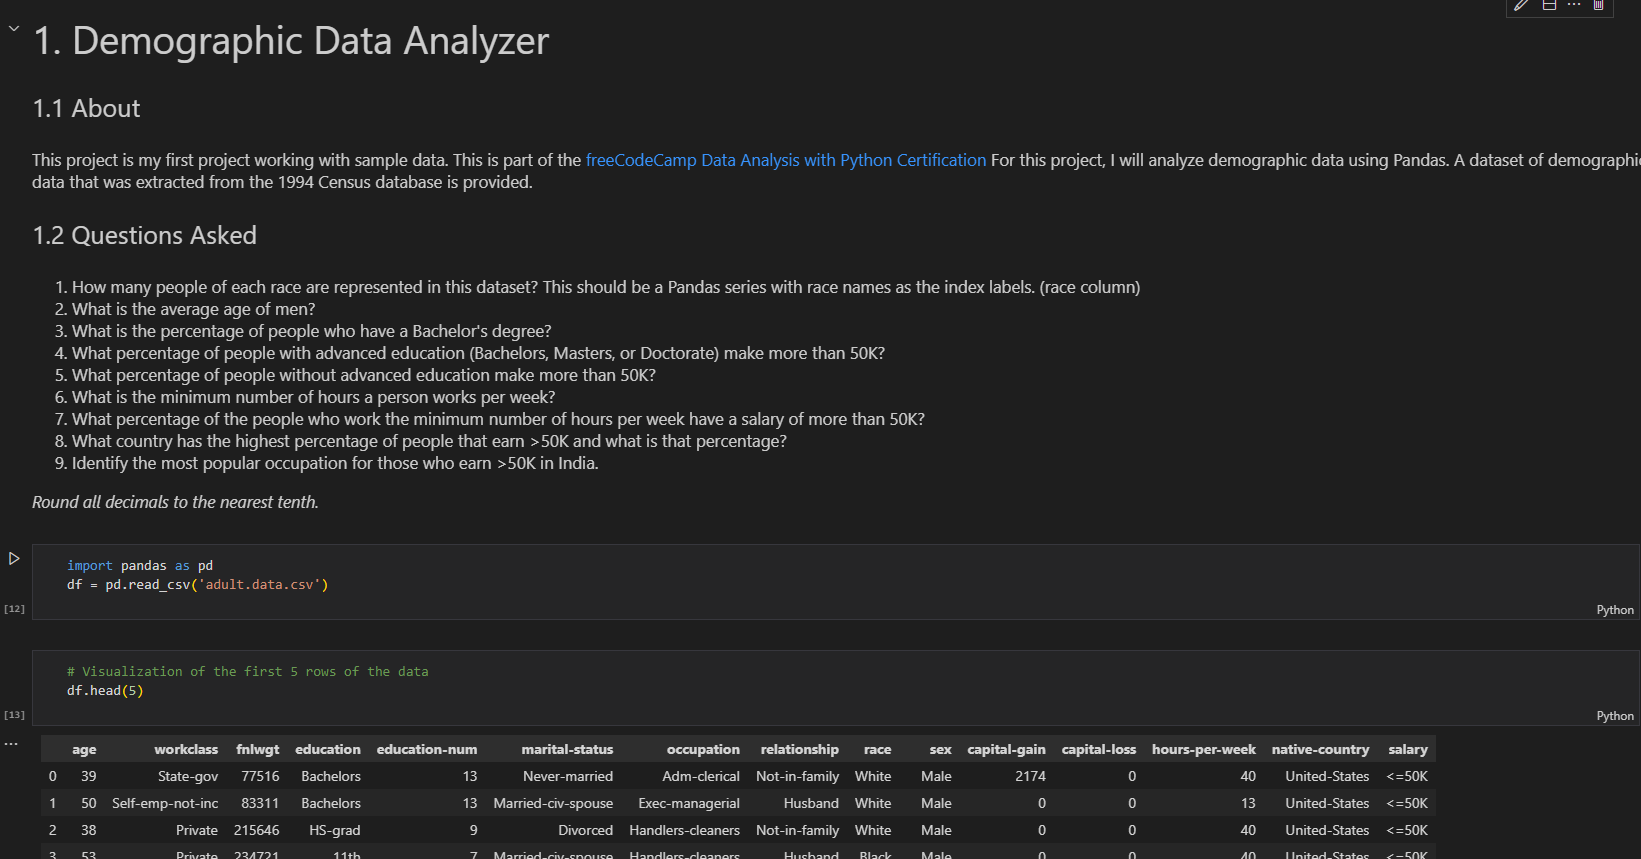
Dissected demographic data using the powerful Python library, Pandas.
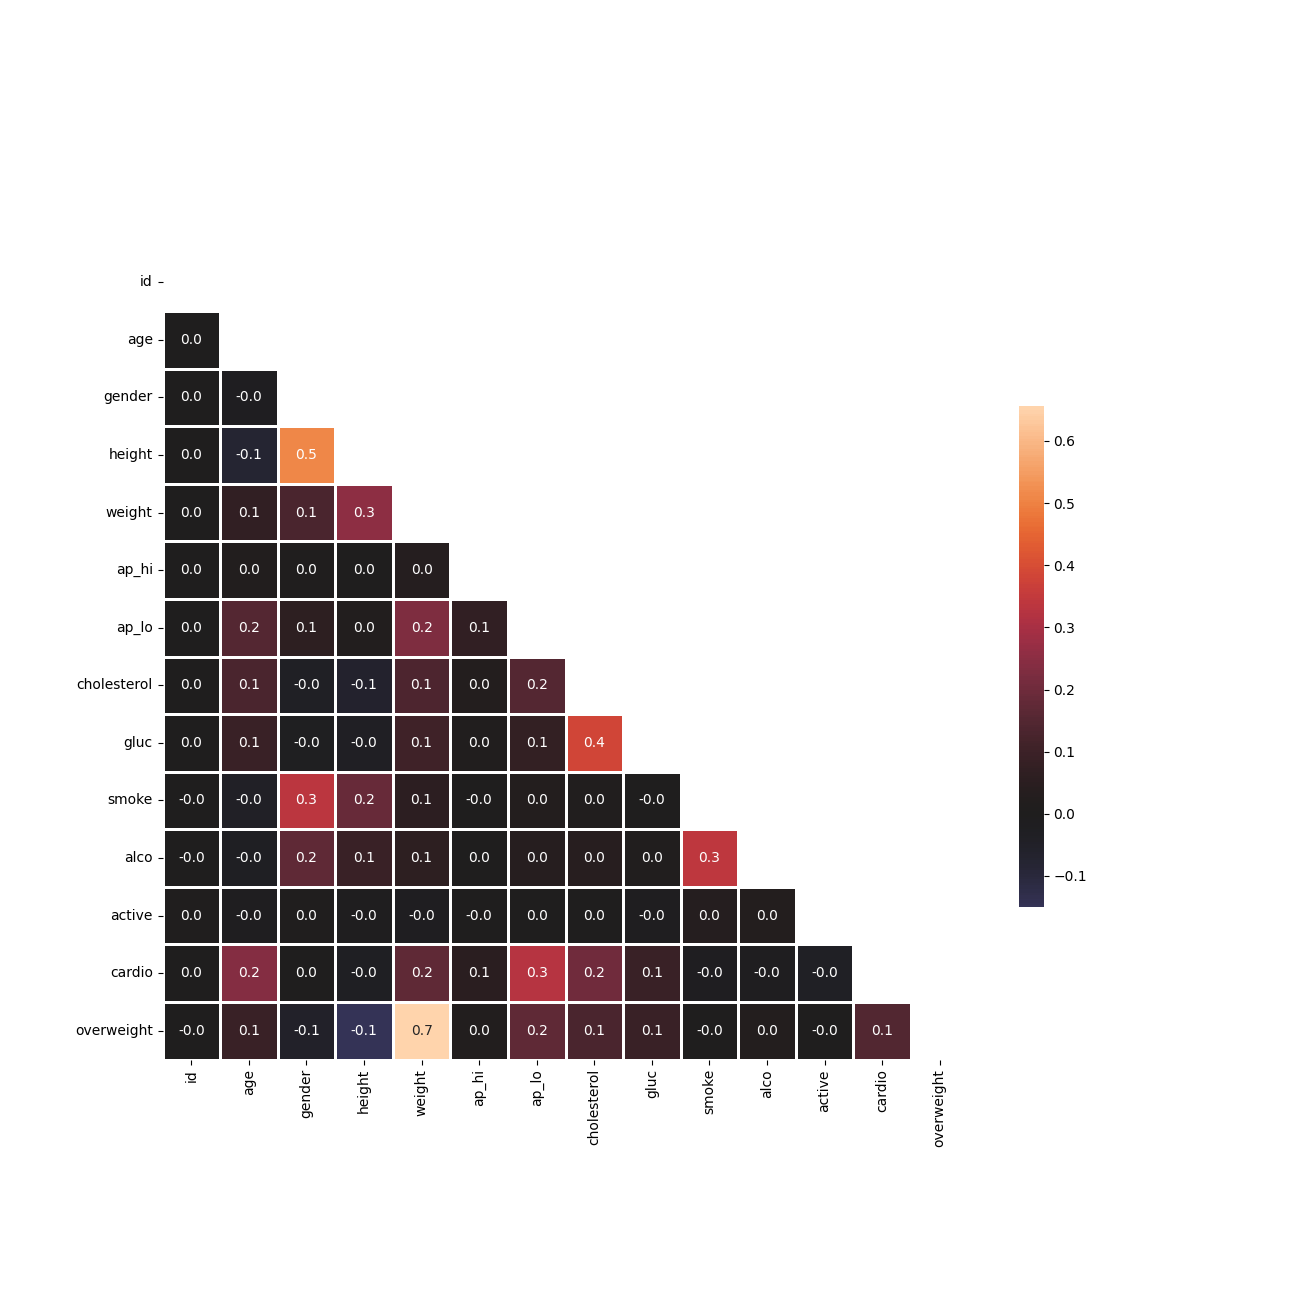
Analyzed medical examination data using Python libraries: Matplotlib, Seaborn, and Pandas.
Here is a list of the tools that I have been practicing: